Archive
Microsoft Project Tutorial Part 28 The resource graph
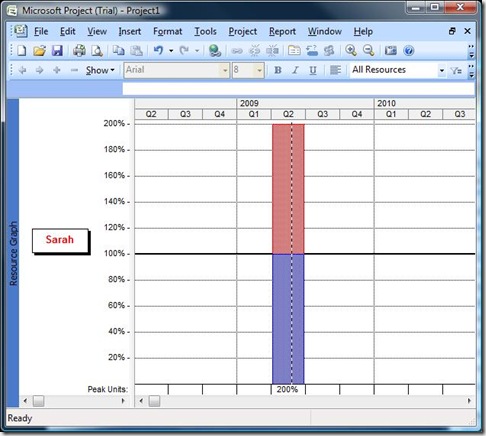
Wouldn’t you say that it’s hard to be Sarah in this example:
When you view the Resource Graph (View—>Resource Graph), it can look something like this.
On the left side you have a resource. If you scroll the left scroll bar, you select resource. And on the right side you have the graph, showing some kind of information. But what are you look at?
Well, if you look at the text just over the left horizontal scroll bar you can see that it reads “Pek Units”. This means that Sarah has assigned AT THE MOST 200% during Q2 2009.
If you change view to Gantt chart, you can see that she’s not so very booked after all:
She’s actually booked 200%, but just during 1 minute. So, don’t take the resource graph too seriously.
But the resource graph can be used. If we switch back you can see that you can right click the diagram part and choose metric. And here Work probably says more that Peak Work:
And if we use a better project, it actually says something. When I changed to a real project, changed metrics to Work and customized the timescale (double click timescale) to show months and weeks, I can see the work load for each resource per week:
Compare this with the same view but with Peak Units selected instead;
Too much heat
If I wasn’t a skeptic, I would probably see it as an omen, but since I’m just a boring gal, I just see it as freak coincidences. When I started at TUI Nordic, I got a brand new phone and after a month, the camera burned. No, not the battery, the camera short circuited and caught fire.
Strange.
Well, my computer started acting weird a couple of months ago. It has been increasingly difficult to use it. It has just stopped working at time and sometimes restarted itself out of the blue. The last strange thing was when I realized that it worked “best” while on batteries.
Well, today, my new computer arrived and I turned in the old one. They actually got it started but when I came back after an hour, he’d placed the thing on the side. He’d found the problem. It was over heating. So, it just started because I hadn’t tried using it over the weekend. But when he had it up and running it after a few minutes reached a temperature of 70C.
Am I working too hard, or say? They use to say that I’m passionate about my projects but burning the equipment is pushing it too hard.
Microsoft Project Tutorial Part 27 – WBS (Work breakdown structure)
Every time I write a new post in my tutorial, I think it will be the last. And then I realize that there is something I’ve missed. And of course, I’ve missed the grouping and filtering functionality.
The most basic grouping functionality has already been covered: the usage of heading tasks:
This is, if you’ve forgotten (or missed that class), achieved by selecting tasks A1 & A2 and clicking ![]()
All tasks have an ID but they also have a WBS code. WBS stands for work breakdown structure and if you right click a column and select Insert column, you can select to insert the WBS field.
The column to the left is the ID field while the WBS field is the field to the right.
You can actually customize the WBS codes. This is very useful if you have inserted projects, when both the ID column and WBS column will have duplicates.
So, to customize the WBS code, you select Project—>WBS—>Define Code.
This dialog box is empty if you view it on a new project, which means numeric values are used and the different levels are divided by dots(.).
On the first row, you can see a preview of your defined code. On the second row, you can specify a Project Code Prefix, and this is as I mentioned; a very good thing if you have inserted project files.
In the grid, each row specifies a level in the WBS code and if a level isn’t defined, the rule with numbers and dots is used. On each level you specify what kind of symbols divides the different values and here you most commonly choose between numbers and letters. You can also see that you can choose between uppercase and lowercase. In the column length, you can specify how many signs can be used in that position, so if you select 1 there can only be 1,2,3,4,5,6.7.8 and 9 in that position. In the separator position you specify which separator is used.
As you can see in the bottom of the dialog box, you can also select to not making the WBS code automatic. The reason for this is that if you refer to this number in other documentation and the insertion of new tasks are done, the WBS codes of other tasks can be changed.
Confirm with OK and have fun with your WBS codes!
Midnattsloppet 2008
I wonder who the loony in the templar knight’s costume is?
Customize fields in Microsoft Project
There are so many fields in Microsoft Project, so why should you want to customize some new ones? Well, there are many reasons. Here are some examples of how you can use customized fields.
There are quite a few fields which you can customize:
- Text 1-20
- Finish 1-10
- Start 1-10
- Number 1-20
- Flag 1-20
- Date 1-10
- Cost 1-10
The simplest way to use these fields is just showing them like the image above and start printing in information, but below you can see how they can be used:
- In the Text1 field, the user can enter values from a list (High, Medium and Low) and depending on the value, different flags are displayed.
- Start1 and Finish1 are used to specify during which times the tasks can be tested. This is also displayed as bars in the Gantt chart.
- Work B2-B1 and Cost B2-B1 are calculations which compares the values in Baseline 2 with Baseline 1.
- Flag1 is used to specify if the specification of the task is completed. If the user enters the value Yes, this task is flagged by a green lamp. Otherwise, the lamp is red.
And here is how you customize fields.
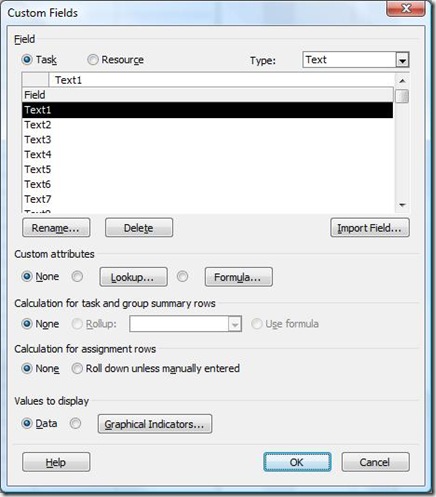
First you insert the field by right clicking one of the present columns and select Insert field. You can then right click the field and select Customize field.
On the top of the dialog box you can see that you can customize fields in task views (like Gantt chart) and resource views (like Resource sheet). You can here also select which field type you want to customize in the dropdown. This means that you can customize all fields at the same time, but for me; I prefer looking at my field when I’m done.
If you click the button Rename, you can enter the new name and confirm.
Under the custom attributes, you can select None, Lookup or Formula. None is used if you want the user to enter values normally. Lookup is used if the user is to select values in a dropdown (like Risk level in the example). Formula is used if the user is not to enter values manually but if project is to calculate the values (like the comparisons between baselines).
If you enter formulas, the result can look something like this. Please observe that the fields are entered by you clicking Field and selecting the correct field in the dropdown:
If we return to the dialog box for Customize fields you can see that you can specify how Heading rows are handled. Depending on your other selections, the options here will differ but remember to take care of this section as well. The same goes for assignment rows. This is applicable if you view Resource Usage or Task Usage. In the chart part you can insert assignment fields.
Finally we move on to the graphical indicators. If you make no changes here, the entered values will be displayed but if you click here you can in the grid specify which images are to be displayed under which conditions. Please observe that on top of the dialog box can you specify how graphical indicators are used on summery rows and the project summery row (which is displayed if you specify this in the Tools—>Options—>View dialog box).
Microsoft Project Tutorial Part 25 – Print setup
I guess one of the main reasons for people using Microsoft Project is that they want to print the Gantt chart, and here people get really frustrated. They cannot get the right stuff on paper.
Well, the first advice is to specify a table definition which is suitable for printing. For example you can leave out the Indication field. How you define your tables is covered in the blog post on customizing your Gantt chart.
Next thing is that you can actually use your divider between the table and the chart. The columns which can be seen in full are normally visible on the print out.
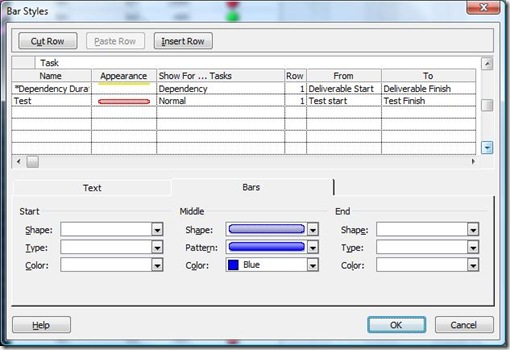
Next thing you can do is that if you want to keep the legend at the bottom of the printouts but think the legend include to much is selecting Format—>Bar styles. If you add a * before the Name of a bar style, it would be included in the legend. Often, people understand most of the types, so just add the * to all styles which are not self explaining. Below, you can see some examples of how it looks like in the dialog box:
Then you move on to File—>Page setup. On the first page you can set the number of pages and orientation.
If you click on the Margins tab, you can set the margins.
On the Header tab, things start to get interesting. First you click the tab for the alignment for the text you wish to include. You can now add default text or field information by clicking the butcons or selecting a field and clicking the Add button. Observe that the last butcon enables you to include an image.
The Footer tab is very much the same as the Header tab, but here you set the footer instead.
When we head to the Legend tab you can specify if the legend is to be visible and for how many pages. Observe that besides the legend, this space also occupy an extra footer. One way to give more space to your Gantt chart on each page is setting the width of this area to 0. But also remember that the fewer items that are displayed on the legend, the smaller the legend becomes.
The View Tab can also be used to specify size. Here you can with the first two check boxes specify if you don’t want the visible columns to be printed and instead specify a number of columns. You can also select to print notes, that is the content of the field Notes. If this is selected, your printout will be complemented with an extra page with comments.
Unmarking Print blank pages is a way to remove unwanted printouts. When you make a printout, Project prints pages so you can tape all the pages together to make a large plan. This means that some pages of the Gantt chart can be without any bars. But remember that if you do mark this, a taped plan will have holes in it. Fit timescale can be used if you don’t want Project to take you timescale setting into consideration but instead trying to make the most of the space. I normally unmark this.
Confirm with OK and go on printing. Printing Project is a hassle so go get yourself a A3 printer and exercise print training.
Microsoft Project Tutorial Part 24 – Exploring the toolbars
There are lots of nice commands in the toolbars . So here are some suggestions on commands to use:
 Copy Picture – enables you to save a picture to Computer clipping. When you chose this command, a dialog box is displayed and you can select what to copy. If you chose clipboard, you can next open for example word and select CTRL+P to paste the picture in your document.
![]() Toolbar for custom forms. Displayed by selecting Tools—>Customize—>Custom forms. You can now select a task in Gantt chart and click one of the butcon. You can now update your tasks easily concerning costs, work status, etc.
Toolbar for custom forms. Displayed by selecting Tools—>Customize—>Custom forms. You can now select a task in Gantt chart and click one of the butcon. You can now update your tasks easily concerning costs, work status, etc.
 Excellent butcon if you use Resource Usage or Task Usage views. If you select a cell, clicking this butcon will mark the next over allocated cell.
 Mark a task in the table of your favorite view and the chart will show the selected task.
![]() Toolbar for tracking progress. Is displayed when you select View—>Toolbars—>Tracking. Observe the butcons with the %:s. These are used to quickly set % Complete. The second, third and forth butcon requires some extra explaining, which I’ll perhaps discuss in upcoming posts. As for now: don’t use them if you don’t understand what they do.
Toolbar for tracking progress. Is displayed when you select View—>Toolbars—>Tracking. Observe the butcons with the %:s. These are used to quickly set % Complete. The second, third and forth butcon requires some extra explaining, which I’ll perhaps discuss in upcoming posts. As for now: don’t use them if you don’t understand what they do.
Microsoft Project tutorial Part 23 – Making a process diagram
When I’m using the Network diagram function in Microsoft, I always turn of the automatic placing of boxes. Format—>Layout:
Select Allow Manual box positioning and confirm with OK.
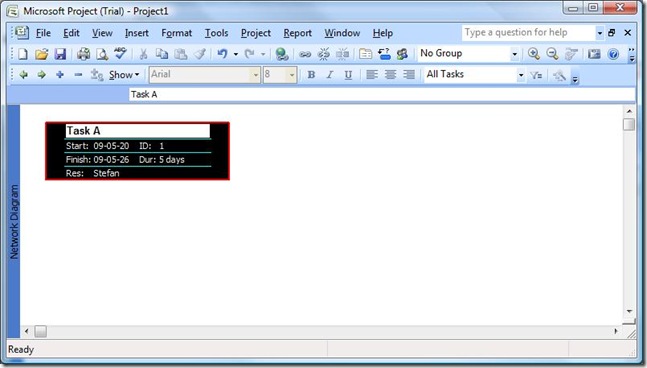
To create the first box, click and drag and when you let go of the mouse, a nex box has been created:
You can now click in the different fields, enter text and confirm by pressing TAB. For example:
If you move the cursor to the middle of the box and click and drag to outside of the box, a new linked task is created:
If you instead click and drag outside the boxes, a new unlinked task is created:
Also observe:
- You can use Indent and Outdent and all other commands as usual
- Double clicking a box opens the Task Information dialog box
- Double clicking a link opens the Link details dialog box
- Double clicking outside the boxes opens the Box Styles dialog Box
- If you switch view, for example to Gantt chart, the information in the Gantt chart is based on your changes here.
If you change the duration of a task to 0, the task becomes a milestone task. The form changes by this. Observe that you can using Box Styles specify which format and data all boxes have.
If you click and drag from one box to another, you can create new links:
Observe that you can use the zoom buttons to zoom in and out to view more or less of your diagram:


Recent Comments