Archive
Microsoft Project Tutorial Part 22 – Planning an agile project
Yes, I wasn’t supposed to do this just yet, but since the number 1 request after the last post was just how I use project during an agile Project, here goes.
1. Fix the settings
Tools—>Options is the first place to go. I start with the calendar settings setting a focus factor. In the example below, I use a 25 hour working week:
I then move on to the Schedule tab and change assignment unit to Decimal and Duration to Weeks. Default task type should be Fixed duration (without effort driven) or Fixed Work, depending of what you like but here I use Fixed Duration.
I move on to the Calculation tab and deselect Updating task status updates resource status:
I confirm with OK and move to Tools—>Change Working time.
This dialog box works differently in different versions of Microsoft Project. In one of my previous posts, I described it as it works in version up until 2003. In version 2007 you select the Work Weeks tab and click Details.
Select all working days, Set day(s) to these specific working times: and the time you specified in Tools—>Options.
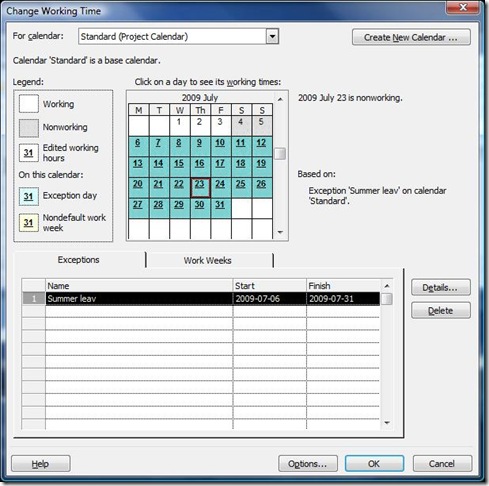
Add other holidays and free time. In Project 2007 you add a new exception, specify dates and click Details. There you can specify that these times are non working. (I think the new dialog box in 2007 is really confusing so make sure that the days are really off. It should look something like this before you click OK:
Then I double click the time scale and set the Middle Tier:
And the Bottom Tier:
Click OK.
Then I select Format—>Grid lines and set Gantt rows and Bottom Tier column as dotted:
I insert the column Work and now I have a Gantt chart which looks something like this:
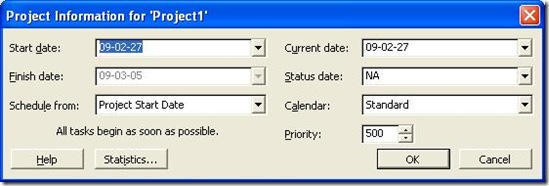
I set the Project Start under Project—>Project Information:
Confirm with OK.
If I just want to make a simple plan, I just enter the sprints and add the sprint length in Duration:
I then link the sprints to each other (for example by dragging the bars to the next sprint:
You then move on to the Resource sheet which you can find under the View menu.
Here you enter your resources and now you see why you changed the metric for units: instead of talking percentage you specify how many guys you have of each type. Of course you can enter names here instead. I do so when different resources are available during different parts of the project.
I can now for each sprint plan how many resources are working on each sprint by returning to the Gantt chart. I click ![]() , select a sprint and enter how many resources are available during that sprint:
, select a sprint and enter how many resources are available during that sprint:
The result looks something like this. As you can see I can see how many man hours we can count on during each sprint and this gives you an idea of how velocity might fluctuate due to resource changes.
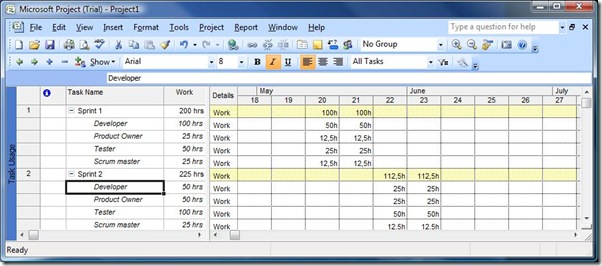
Now I can update status, take out reports, etc on a project level. For example using the Task Usage view:
Or the resource usage view:
Observe that you can right click the chart part of these views and add Baseline values and Actual values if you wish to view or update this.
But during the sprints then? Well, I use other tools then in the form of TFS and the Scrum dashboard based on Conchango Work item template. I have no need to track this double, so I don’t use the Project integration. Project is good for planning and follow up plans, not for keeping requirements or priorities,
If I’d used Project during the sprints, I would create a new project file for each sprint and insert hyperlinks between the files. Just so I focus on that sprint and don’t mix up the metrics.
And this is the full extent of my using Project in an agile project. The usage of the calendar functions makes it easy to calculate how much man hours we have available and since I use the Gantt chart form, it is easier to show the stuff for managers.
Yes, you still have the risk that “add a new resource late in the project” looks great in the calculations, but that is up to me to debate with the stakeholders. To make them understand the logic and the effects.
Microsoft Project Tutorial Part 15 – Reporting progress a more in detail
When work does not follow duration
When different resources work with different pace
When you need to track progress over time
If you need to know when resources spent time on the different tasks you can also select to work in the Resource Usage View or the Task Usage View. If you right click in the chart part you can select to add the field Actual Work. Here you can enter actual work on all assignment rows (white). I also often include the field Remaining Work in the table part so I can see how much time remains of current plan. Observe that you can on both places also choose to view the Baseline Work to see the original plan.
Microsoft Project Tutorial Part 14 – Reporting progress simplest ways
For some, this is when Microsoft Project gets really interesting, for most, this is when you give up using the program. The most important thing you can do is decide how much effort you want to put into reporting progress. The second most important is what you want to track.
This first post is just going to show the easiest ways: an upcoming post will cover the more complicated methods.
The simplest solution – just track percentage complete
The easiest thing you can do is that you can simply just select how much of the task has been completed.
For accomplishing this you have a field called % Complete.
If you insert this column in the Gantt chart you can simply change the value. Another method is selecting Window—>Split and change the value there:
You can also select View—>Toolbar—>Tracking. This toolbar include butcons for some different values for % Complete.
When you start changing this value you can see that something happens to your bars in the Gantt chart. They become filled with a black line. This shows the actual progress.
But how is it calculated?
Well, up until now, we’ve talked about Duration and Baseline Duration. The difference between these two values were covered in the previous session of this class but to put it shortly: the Duration value shows us the current plan and Baseline Duration shows us the plan when we started the project (or the last time you saved a baseline).
Now we add two more columns into this mess: Actual Duration and Remaining Duration.
Duration = Actual Duration + Remaining Duration
The part of Duration which is Actual Duration is % Complete. Easy as pie! Or not…
I gave the example with Duration, but you can also add the same thinking to Work, Cost, etc. You can easily insert these columns and watch the values for yourself.
So, when it comes to the easiest way to track progress, it’s simply just adding this column and change % Complete.
The easiest way to get a feeling for the project is showing Project—>Project Information—>Statistics. Her you can see the current plan, Baseline, Actuals and remaining.
Microsoft Project Tutorial Part 13 – Save Baseline, A K A Start the project
Before you get cracking at completing your new project using Microsoft Project, you need to stop and think. What do you track during the project?
During the project you need to:
- Track progress, in other words: how much resources are spent and how much time did this take
- Make changes to the current plan
- Compare changes in plans and actual work with the original plan
To enable these tasks, you need to track these. And now it’s time to get back to the terms Work, Duration, Unit and Cost. The meaning of these fields are in fact:
- Work= The planned workload, according to current plan
- Duration = The planned length, according to current plan
- Unit =The planned allocation, according to current plan
If you look at other columns like Cost, Start, Finish, etc, you can see the same pattern: they are all about the current plan.
If you right click a column in for example Gantt chart and select Insert—>Column you can view the column list by browsing the Field name dropdown:
If you scroll up to B you can see a lot of columns starting with the text Baseline. If you continue scrolling to A you find a lot of columns starting with Actual. This is what they mean:
- Baseline Work= The planned workload, according to Baseline plan
- Baseline Duration = The planned length, according to Baseline plan
- Baseline Unit =The planned allocation, according to Baseline plan
- Actual Work= Actual workload, according to current reports
- Actual Duration = Actual length, according to current reports
- Actual Unit =Actual allocation, according to current reports
Baseline is a snapshot of the plan at a given time. To save Baseline, you select Tools—>Tracking—>Save Baseline. In the dialog box you can select which baseline you want to save (you can save up to 10 baselines).
Observe that you can save the Baseline for only selected tasks or the entire project.
When you click OK, the values in the current plan (Work, duration, start, finish, cost, unit, etc) is copied to the baseline columns (Baseline Work, Baseline duration, Baseline start, Baseline finish, cost, unit, etc). So, if you view one of these columns now you can see that they are now filled. You could have accomplished the same if you manually had copied the information. But this is of course a bit faster…
You can now go a head and make changes to your plan. Since the values has been copied, you can compare them later, for example in Tools—>Project—>Project Information—>Statistics.
You can now also switch view to View—>Tracking Gantt.
The grey bars are your Baseline values while the colored are your current plan.
When you switch to the Tracking Gantt you can now see that some of the bars are red. They are the tasks which cannot be delayed without delaying the whole projects. Exactly how much they can delay the project can be found in the column Total Slack. Select Format—>Bar styles and take a look at the definitions in the chart part and you’ll probably get a hang of this.
One tip for the road: don’t delete tasks, assignments, etc after you’ve saved a baseline. Since the baseline values are stored on the same rows in the tables, the baseline values are then lost forever.
Next stop in this guide will be tracking progress!


Recent Comments