Archive
Measuring productivity
You get what you measure
So true, so true. These famous words from Mary Poppendieck point at an important objective of anyone interested in their work.
But there is a risk to these words. Because you can be lead to believe that you can measure everything you want.
I want my son to love me. So, following Mary’s words I should probably measure his love. This should ensure me success in getting his love.
Sounds goofy? Well, to most sane people this sounds crazy. I cannot take out a chart and plot my son’s love for me.
But how about productivity? In the agile community I’ve read a couple of discussions about if you can use velocity to measure productivity. I don’t like this idea much. I use velocity for predictions and my priority. Story point estimates are in my world a relative value of size, and if I start measuring how many dots they complete every month, they are not sure to start making their estimates bigger. I still don’t measure productivity but I’ve also lost my chance of predicting my upcoming deliveries.
So, how do I measure productivity of the developers on my team? Well, I measure it by how happy my users and stakeholders Do they feel that the investment was worth it. But, but, you might say: that is too vague! And I say that just this is what matters. If the customer is happy about the investment. Can they make the money they hade anticipated or save the cost they were counting on.
And frankly, I have a hard time finding a good measurement of productivity. I can just look back at my role; project manager. What is a productive project manager? Is it the one who makes the most Gantt chart bars? Or holds the longest steering groups? How does a project manager know if he’s been productive a day? For me it’s a feeling. Some days I can have had this ten minutes meeting which clarified a lot of stuff which will save us a lot of coding time or make us reach our goals. But a numeric calculation, I don’t know.
It was perhaps easier when I was a test leader. And yet not. A productive tester does not find a lot of bugs, he prevents them from occurring in the first place. And how do you measure that? Yes, you can measure the decline in bugs, but how do you know if a specific tester was the reason.
So, to summarize; I wouldn’t feel productive as a project manager if I was asked to measure the productivity of team members.
Are you planning a project or just drawing a Gantt chart?
I guess the main reason for most project managers to use Microsoft Project is drawing the traditional Gantt chart. It’s kind of obvious, since the Gantt chart view is the default view of the program. This view is also confirmed by the default fields that are visible. A task is in Microsoft Project described by over a hundred fields but only eight of these are visible using the default settings.
If you just start up a default session of Microsoft Project and don’t change any setting, this is how you define a Task:
· Name (Text)
· Duration (Days)
· Start (Date & time, even if only the date is visible)
· Finish (Date & time, even if only the date is visible)
· Predecessors (Numbers – ID of tasks which the task directly depends on)
· Resource Names (Names of Resources)
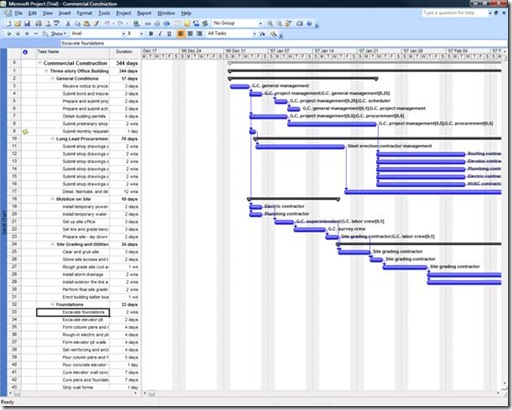
If you open one of the templates provided by Microsoft, they all look something like this:
There are all these tasks where one leads to the other and where the assignment is already done. You’re supposed to enter the Duration (in Days).
What is important is to understand what Duration is and what it’s not. In agile methodologies such as scrum, when defining tasks during sprint, you estimate how much work a task should result in. In other words; how many man hours it is estimated that a task will result in. This attribute is in Microsoft Project referred to as Work. And that is not the same as Duration. You cannot even see Work with the default settings. Work is what you get when you add resources to a task. But why is this? I believe that it all comes back to what I assume is the basic use for Microsoft Project; drawing the Gantt chart.
The Gantt chart is made up of all these blue bars, all connected to each other and leading to the end of the project. So the assumption of the Gantt chart is that if you make a Gantt chart, you can calculate when the project should be completed. That sounds great! Just what my stakeholders want.
The individual bars in the Gantt chart have a length and a place in time. The length is the attribute Duration, and therefore it makes sense to have the attribute Duration clearly visible and editable. And to place the bar in time you can use two methods, you can either link them together or you can place them on a specific date. The linking information is saved in the field Predecessors and you can specify a date by changing the Start or Finish Columns.
The final touch to the Gantt chart is the displaying of the resources names and that is stored in the field Resource Names.
So, there you have it; the columns in the default view of Microsoft Project are the ones which you need to draw the Gantt chart.
But does this mean that you can calculate the finish date of the project based on this? Well I think that experience talks against this. Just the fact that you cannot see the assumed workload makes the planning blind. And as I’ve previously discussed; since the focus factor is 100%, no holidays are in the system and the slack is 0, we all know that this is an illusion. Looking at the Gantt chart, I see the similarity with stairways and you get the feeling that all tasks are individual steps on the stairways. You just have to walk down that and you’re done. You can just check of the steps as you fly by them. Right.
Another problem with having the Gantt chart as the objective of your planning is what you want to do with that Gantt chart. Yes, you want that planned end date but you also want to show the chart to your steering group. And then you need to print it or take a screen copy and enter it into your PowerPoint presentation. Let’s see what happens when we open one of the templates:
But hey, I can’t see all those bars, and I cannot see all those rows! But then I need to collapse the heading tasks and change the timescale:
But then I’m missing out on my nice blue bars and it looks strange. So, to keep my project nice and clean, it’s better to keep the number of tasks down. Also, linking in the Chart view is a pain if you cannot see all the tasks at the same time.
And here, we also see a conflict with agile values. In most agile methodologies, you want to keep the tasks as small as possible to enable more accurate estimates. But this clutter up the Gantt chart, making it hard to read and linking becomes complicated.
Finally, we have another problem with having the Gantt chart drawing as the objective of our planning. The product backlog does not fit into this scenario. A product backlog is a prioritized list of requirements but this does not mean that the product backlog items are interlinked. So you cannot link them in the Gantt chart. But if you don’t link them, you don’t get your Gantt chart.
Next time you start Microsoft Project, ready to create the plan for you next project, keep your objectives clear; is your goal drawing a dreamy Gantt chart or do you have higher goals?
I’ve on this blog posted a tutorial on using Microsoft Project as a planning tool. I cannot say it’s easy but neither is planning. Thinking that you’ve planned your project just because you have a Gantt chart to show your steering group is a first step towards a challenged project.
Customize fields in Microsoft Project
There are so many fields in Microsoft Project, so why should you want to customize some new ones? Well, there are many reasons. Here are some examples of how you can use customized fields.
There are quite a few fields which you can customize:
- Text 1-20
- Finish 1-10
- Start 1-10
- Number 1-20
- Flag 1-20
- Date 1-10
- Cost 1-10
The simplest way to use these fields is just showing them like the image above and start printing in information, but below you can see how they can be used:
- In the Text1 field, the user can enter values from a list (High, Medium and Low) and depending on the value, different flags are displayed.
- Start1 and Finish1 are used to specify during which times the tasks can be tested. This is also displayed as bars in the Gantt chart.
- Work B2-B1 and Cost B2-B1 are calculations which compares the values in Baseline 2 with Baseline 1.
- Flag1 is used to specify if the specification of the task is completed. If the user enters the value Yes, this task is flagged by a green lamp. Otherwise, the lamp is red.
And here is how you customize fields.
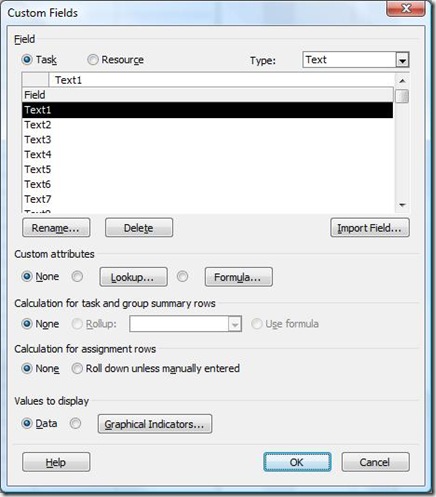
First you insert the field by right clicking one of the present columns and select Insert field. You can then right click the field and select Customize field.
On the top of the dialog box you can see that you can customize fields in task views (like Gantt chart) and resource views (like Resource sheet). You can here also select which field type you want to customize in the dropdown. This means that you can customize all fields at the same time, but for me; I prefer looking at my field when I’m done.
If you click the button Rename, you can enter the new name and confirm.
Under the custom attributes, you can select None, Lookup or Formula. None is used if you want the user to enter values normally. Lookup is used if the user is to select values in a dropdown (like Risk level in the example). Formula is used if the user is not to enter values manually but if project is to calculate the values (like the comparisons between baselines).
If you enter formulas, the result can look something like this. Please observe that the fields are entered by you clicking Field and selecting the correct field in the dropdown:
If we return to the dialog box for Customize fields you can see that you can specify how Heading rows are handled. Depending on your other selections, the options here will differ but remember to take care of this section as well. The same goes for assignment rows. This is applicable if you view Resource Usage or Task Usage. In the chart part you can insert assignment fields.
Finally we move on to the graphical indicators. If you make no changes here, the entered values will be displayed but if you click here you can in the grid specify which images are to be displayed under which conditions. Please observe that on top of the dialog box can you specify how graphical indicators are used on summery rows and the project summery row (which is displayed if you specify this in the Tools—>Options—>View dialog box).
Microsoft Project Tutorial Part 25 – Print setup
I guess one of the main reasons for people using Microsoft Project is that they want to print the Gantt chart, and here people get really frustrated. They cannot get the right stuff on paper.
Well, the first advice is to specify a table definition which is suitable for printing. For example you can leave out the Indication field. How you define your tables is covered in the blog post on customizing your Gantt chart.
Next thing is that you can actually use your divider between the table and the chart. The columns which can be seen in full are normally visible on the print out.
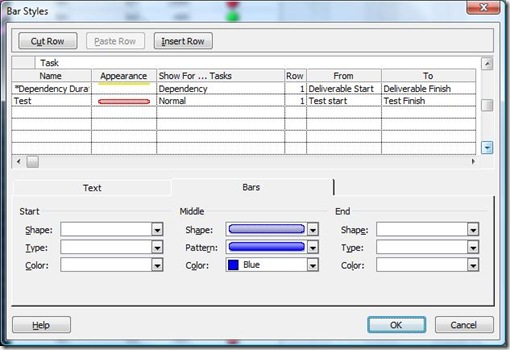
Next thing you can do is that if you want to keep the legend at the bottom of the printouts but think the legend include to much is selecting Format—>Bar styles. If you add a * before the Name of a bar style, it would be included in the legend. Often, people understand most of the types, so just add the * to all styles which are not self explaining. Below, you can see some examples of how it looks like in the dialog box:
Then you move on to File—>Page setup. On the first page you can set the number of pages and orientation.
If you click on the Margins tab, you can set the margins.
On the Header tab, things start to get interesting. First you click the tab for the alignment for the text you wish to include. You can now add default text or field information by clicking the butcons or selecting a field and clicking the Add button. Observe that the last butcon enables you to include an image.
The Footer tab is very much the same as the Header tab, but here you set the footer instead.
When we head to the Legend tab you can specify if the legend is to be visible and for how many pages. Observe that besides the legend, this space also occupy an extra footer. One way to give more space to your Gantt chart on each page is setting the width of this area to 0. But also remember that the fewer items that are displayed on the legend, the smaller the legend becomes.
The View Tab can also be used to specify size. Here you can with the first two check boxes specify if you don’t want the visible columns to be printed and instead specify a number of columns. You can also select to print notes, that is the content of the field Notes. If this is selected, your printout will be complemented with an extra page with comments.
Unmarking Print blank pages is a way to remove unwanted printouts. When you make a printout, Project prints pages so you can tape all the pages together to make a large plan. This means that some pages of the Gantt chart can be without any bars. But remember that if you do mark this, a taped plan will have holes in it. Fit timescale can be used if you don’t want Project to take you timescale setting into consideration but instead trying to make the most of the space. I normally unmark this.
Confirm with OK and go on printing. Printing Project is a hassle so go get yourself a A3 printer and exercise print training.
Microsoft Project Tutorial Part 24 – Exploring the toolbars
There are lots of nice commands in the toolbars . So here are some suggestions on commands to use:
 Copy Picture – enables you to save a picture to Computer clipping. When you chose this command, a dialog box is displayed and you can select what to copy. If you chose clipboard, you can next open for example word and select CTRL+P to paste the picture in your document.
![]() Toolbar for custom forms. Displayed by selecting Tools—>Customize—>Custom forms. You can now select a task in Gantt chart and click one of the butcon. You can now update your tasks easily concerning costs, work status, etc.
Toolbar for custom forms. Displayed by selecting Tools—>Customize—>Custom forms. You can now select a task in Gantt chart and click one of the butcon. You can now update your tasks easily concerning costs, work status, etc.
 Excellent butcon if you use Resource Usage or Task Usage views. If you select a cell, clicking this butcon will mark the next over allocated cell.
 Mark a task in the table of your favorite view and the chart will show the selected task.
![]() Toolbar for tracking progress. Is displayed when you select View—>Toolbars—>Tracking. Observe the butcons with the %:s. These are used to quickly set % Complete. The second, third and forth butcon requires some extra explaining, which I’ll perhaps discuss in upcoming posts. As for now: don’t use them if you don’t understand what they do.
Toolbar for tracking progress. Is displayed when you select View—>Toolbars—>Tracking. Observe the butcons with the %:s. These are used to quickly set % Complete. The second, third and forth butcon requires some extra explaining, which I’ll perhaps discuss in upcoming posts. As for now: don’t use them if you don’t understand what they do.
Microsoft Project Tutorial Part 22 – Planning an agile project
Yes, I wasn’t supposed to do this just yet, but since the number 1 request after the last post was just how I use project during an agile Project, here goes.
1. Fix the settings
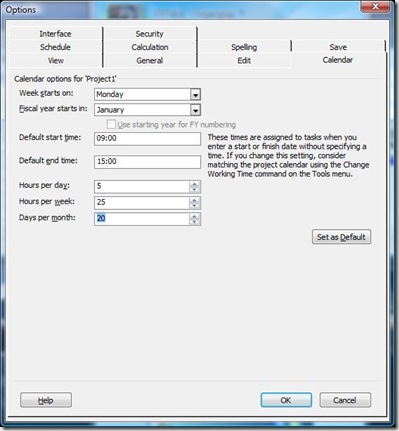
Tools—>Options is the first place to go. I start with the calendar settings setting a focus factor. In the example below, I use a 25 hour working week:
I then move on to the Schedule tab and change assignment unit to Decimal and Duration to Weeks. Default task type should be Fixed duration (without effort driven) or Fixed Work, depending of what you like but here I use Fixed Duration.
I move on to the Calculation tab and deselect Updating task status updates resource status:
I confirm with OK and move to Tools—>Change Working time.
This dialog box works differently in different versions of Microsoft Project. In one of my previous posts, I described it as it works in version up until 2003. In version 2007 you select the Work Weeks tab and click Details.
Select all working days, Set day(s) to these specific working times: and the time you specified in Tools—>Options.
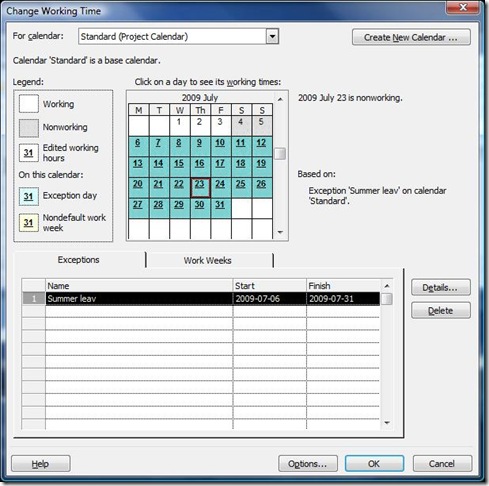
Add other holidays and free time. In Project 2007 you add a new exception, specify dates and click Details. There you can specify that these times are non working. (I think the new dialog box in 2007 is really confusing so make sure that the days are really off. It should look something like this before you click OK:
Then I double click the time scale and set the Middle Tier:
And the Bottom Tier:
Click OK.
Then I select Format—>Grid lines and set Gantt rows and Bottom Tier column as dotted:
I insert the column Work and now I have a Gantt chart which looks something like this:
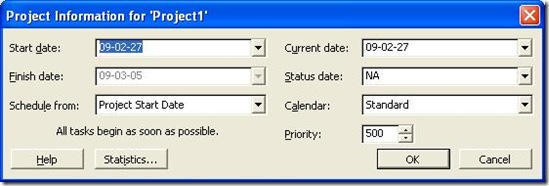
I set the Project Start under Project—>Project Information:
Confirm with OK.
If I just want to make a simple plan, I just enter the sprints and add the sprint length in Duration:
I then link the sprints to each other (for example by dragging the bars to the next sprint:
You then move on to the Resource sheet which you can find under the View menu.
Here you enter your resources and now you see why you changed the metric for units: instead of talking percentage you specify how many guys you have of each type. Of course you can enter names here instead. I do so when different resources are available during different parts of the project.
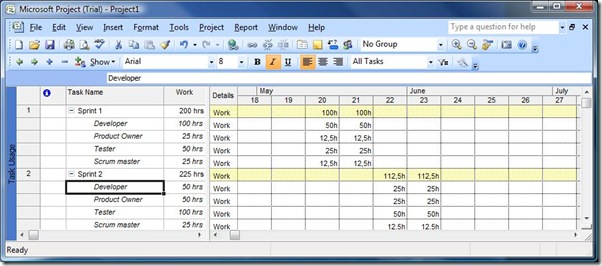
I can now for each sprint plan how many resources are working on each sprint by returning to the Gantt chart. I click ![]() , select a sprint and enter how many resources are available during that sprint:
, select a sprint and enter how many resources are available during that sprint:
The result looks something like this. As you can see I can see how many man hours we can count on during each sprint and this gives you an idea of how velocity might fluctuate due to resource changes.
Now I can update status, take out reports, etc on a project level. For example using the Task Usage view:
Or the resource usage view:
Observe that you can right click the chart part of these views and add Baseline values and Actual values if you wish to view or update this.
But during the sprints then? Well, I use other tools then in the form of TFS and the Scrum dashboard based on Conchango Work item template. I have no need to track this double, so I don’t use the Project integration. Project is good for planning and follow up plans, not for keeping requirements or priorities,
If I’d used Project during the sprints, I would create a new project file for each sprint and insert hyperlinks between the files. Just so I focus on that sprint and don’t mix up the metrics.
And this is the full extent of my using Project in an agile project. The usage of the calendar functions makes it easy to calculate how much man hours we have available and since I use the Gantt chart form, it is easier to show the stuff for managers.
Yes, you still have the risk that “add a new resource late in the project” looks great in the calculations, but that is up to me to debate with the stakeholders. To make them understand the logic and the effects.
Microsoft Project Tutorial Part 21 – Splitting tasks
Sometimes you realize during a project that you need to split a task. So how do you go about that? Well, like with everything i Microsoft Project, it depends. So, I’m going to show you two alternatives.
We start with the following Project:
We have two tasks, of which one was added after we saved baseline.
If we view the Resource Usage view, we can see the planned work:
OK! Let’s do some splitting. We return to the Gantt Chart view and hit the Split task butcon: ![]()
We move the cursor to one of the tasks in the Gantt chart and voilâ, we get some help with our splitting:
Click where you want the split to begin. The result will be something like this:
You can now drag the right part of the task bar to specify how big gap you want. But what did really happen? Well, to see that we move back to the resource usage view:
Can you see what happened? 8h work was moved from that Thursday to the Monday about a week later.
So, what is keeping you from doing this manually in the Resource view? Well, actually nothing but when you do this manually, you need to have a look at the total sum in the Work column. But below I create a split in task B by moving some hours from Thursday and Friday to the coming week:
When we return to the Gantt chart we can see that it looks exactly the same (besides me creating a longer gap manually:
How do you remove a split in a task? Well, one method is to take the right bar and drag it to the left. Or you can start adding some numbers to the dates with 0:s in the Resource Usage view.
But now we move on the other, fundamentally different method of creating splits.
The previous method only works when you want to stop the work between two specific dates but it does not help you if you want to add a task in the gap and that the gap depends on the length of that task. So, here goes.
First, I add two new tasks between task A and B. The easiest way to do this is to select a field on row two and hit the INSERT button. I call the new tasks A1 and A2. The next thing I do is that I make the specifications for these two new parts. That is, I specify length and add resources.
Next thing I do is that I set the Units of Bobs assignment on Task A as 0%. The reason for me not removing the assignment is that I have a baseline value, and I don’t want to lose this history (a previous blog post discusses deletion specific)
I then select tasks A1 and A2 and click ![]() . Your plan should right now look something like this:
. Your plan should right now look something like this:
And now you can go ahead and start linking. I Link task A1 to B and B to A2. The result will look something like this:
In other words, you have created a split and you can now select to hide the sub tasks. But if you do so, you will not see the split in Task A. To accomplish this you select Tasks A1 and A2 and click the ![]() butcon.
butcon.
Make sure not to change anything else but that Roll up Gantt bar to Summery is selected:
The result will look something like this:
Well, now you can see the split, but that black bar doesn’t look nice. So we double click Task A and select Hide Task Bar. Observe that Show rolled up Gantt bars is what makes the sub tasks visible on this row so if you have a problems when sub tasks are visible or not visible on a summery task this can be a good place to look.
Now things should look like this:
But it really looks best if you hide the sub tasks for Task A:
This ends another series on how to use Microsoft Project and I’ll wait for a while before adding more posts on the subject but if you have a favorite topic which you want me to cover, please get back to me. Otherwise, I’m considering how I use Project when planning for scrum projects.
Microsoft Project Tutorial Part 20 – Debunking the critical path
The Critical path, a wonderful way to find the critical tasks in a project, wouldn’t you say? Well, perhaps not. Here goes. We have a project:
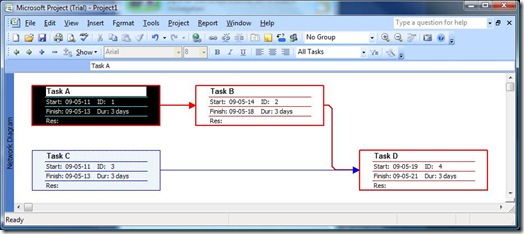
According to Microsoft Project. the tasks which are included in the critical path are A, B and D. How can I see that? Well, using the default Gantt chart you cannot see this, but if you switch to the Network Diagram (View—>Network diagram) shows you just this:
Other ways to view the critical path is to use the Gantt chart wizard or viewing the Tracking Gantt:
But what is the critical path?
Well, everything in Microsoft Project is based on calculations and fields and the critical path is no different. We insert two fields, Critical and Total slack.
Do you spot the pattern? Yes, what differs task C from the others is that Total Slack is over 0 and Critical is set to No. You cannot manually change Critical, since it’s based on Total Slack. So, the definition of a task belonging to the critical path is that total slack is 0, which leads to Critical being Yes. So, if we want C to become critical, we can change the duration with 3 days.
And if we add another day to the duration of C, guess what happens:
Yes, now that C > A + B, A and B are no longer critical.
If you look at this very briefly, it sounds all right, but really; we have no idea at this point which type of tasks we’re dealing with. Are all tasks as crucial? Critical path does not take into consideration how devastating it would be for D if C was not completely finished. Perhaps we can start anyway?
The problem is not unique to the Gantt chart view, the network diagram have the same problems and if you use some kind of PERT diagram, you will see the same definition.
As with everything using a tool like Microsoft Project it is important to understand how the program works. Think about your definition of a word like Critical and compare that to the definition in Microsoft Project.
I end this post with yet another setting in Microsoft Project. I wrote that the definition of a task being Critical as Total slack being 0. If you have very long tasks, this might not be very telling. Perhaps you want Project to highlight all tasks which cannot be delayed more than 5 days before turning red in your diagram. You can then select Tools—>Options. Select the Calculation tab and change the setting of Tasks are critical if slack is less than or equal to X days.
Microsoft Project Tutorial Part 16 – Being fooled by a Gantt chart
One of my biggest problems with Microsoft Project is that almost everyone can fool others (and themselves) by showing a Gantt chart, which is not thought through. It looks so valid!
As I explained in previous posts, one of my main reasons for giving these classes is to educate people about how hard it is to use Microsoft Project and how much effort you need to put into a Project file to make it the tool you want in your project. And sometimes Microsoft Project does not help you with what you want. For example, Microsoft Project will not help you solve resource conflicts. Yes, it can help you spot them but the automatic tools are too automatic to be of any use to a real project.
In this post, I will point at some real time problems which most users falls into. I will probably get back to this subject, but I guess this post will show the graveness of the problems.
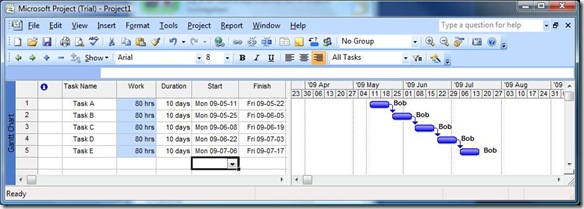
Here is the first example. Take a look at this wonderful Gantt Chart. Great isn’t it:
When I view the Resource Sheet I can see that there are no over allocations. So, things are great, aren’t they?
Well, the answer is probably no.
I’ve been using the default settings, which will mean that this project will most definitely fail. And what does this say about a project when the default settings makes the project a failure.
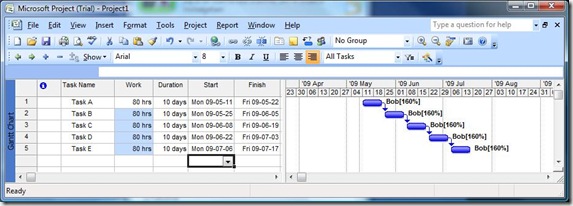
The first problem is that the plan says that poor Bob will work 8h a working day with this project. Yes, he probably works full time, but does this mean that he will add 100% value and effort into these tasks? Probably not. We all know that it doesn’t work like that. Just to give you an example, you can see what happens when I add the Work column. I can now see how much work we expect Bob to put into the project:
A lot of work, wouldn’t you say? But if we made this more realistic, perhaps Bob has a focus factor of 5 hours per working day. To enable this, we need to change the Project settings and the calendar.
When I do this, the plan tells another story. If I keep the 80 work per task scenario, each task will be prolonged with 6 days:
That is a delay of 30 WORKING days. So, instead of the project finishing on July 17th, it ends on August 28th. And this is not due to any delays, changes in scope or plan. Just that Microsoft Project tricked us into believing in a non working plan. Scary, isn’t it. But another scenario can be that we stick to the original deadline. What happens then is that either do we cut the work, which result in the following scenario:
Now, we cut 30 hours of work from the original plan. And that is per task. 150 hours of work in total. That is a lot of hours we were counting on but cannot be performed. We could also play the evil project manager card and force poor Bob make those hours before the deadline:
Poor Bob. Working 160% is not what you want, is it. And people wonder why there are so many delays and burnt out people in the business. A project manager uses the default settings in a standard program. But let’s get back to to the first scenario. Let’s say that we take the delay, so we are back at our delayed project. We are done by August 28th, aren’t we?
Well, if your guys love spending all summer at the office. I guess Bob hasn’t counted on a vacation in Florida this summer. There are no holidays added and no vacations. So, you have to add this yourself. Now, the effects of this differs from country to country but even if you’re American and perhaps just have a two week vacation, the effects are visible. And do remember that this is a project with just one participant. What if they are more and they are off on different times. Will the project work with the same pace anyway? But even if we use just a simple one project and two weeks off we are now moving into September.
OK. But now, we’re OK. Aren’t we? Well, no. Have you ever been in a situation where you ended one task and the next second, you started with the next? well, this is what the plan says. The exact minute when one task has stopped, you can start with the next. What is reasonable? Well, it depends on the project and it depends on the task. But let’s say that you need to deploy, make some changes in your settings, etc etc. We’ll be reasonable and say that we will perhaps miss two working days between each task.
The effects are not huge, but they are there:
We are slowly moving nearer October. And let me just remind you that we have still not made any changes to our plans.
And this is just one example. I will soon get back to other, fundamental problems with using Microsoft Project in our planning process but I hope you will be more skeptical next time you see a Gantt chart.


















Recent Comments